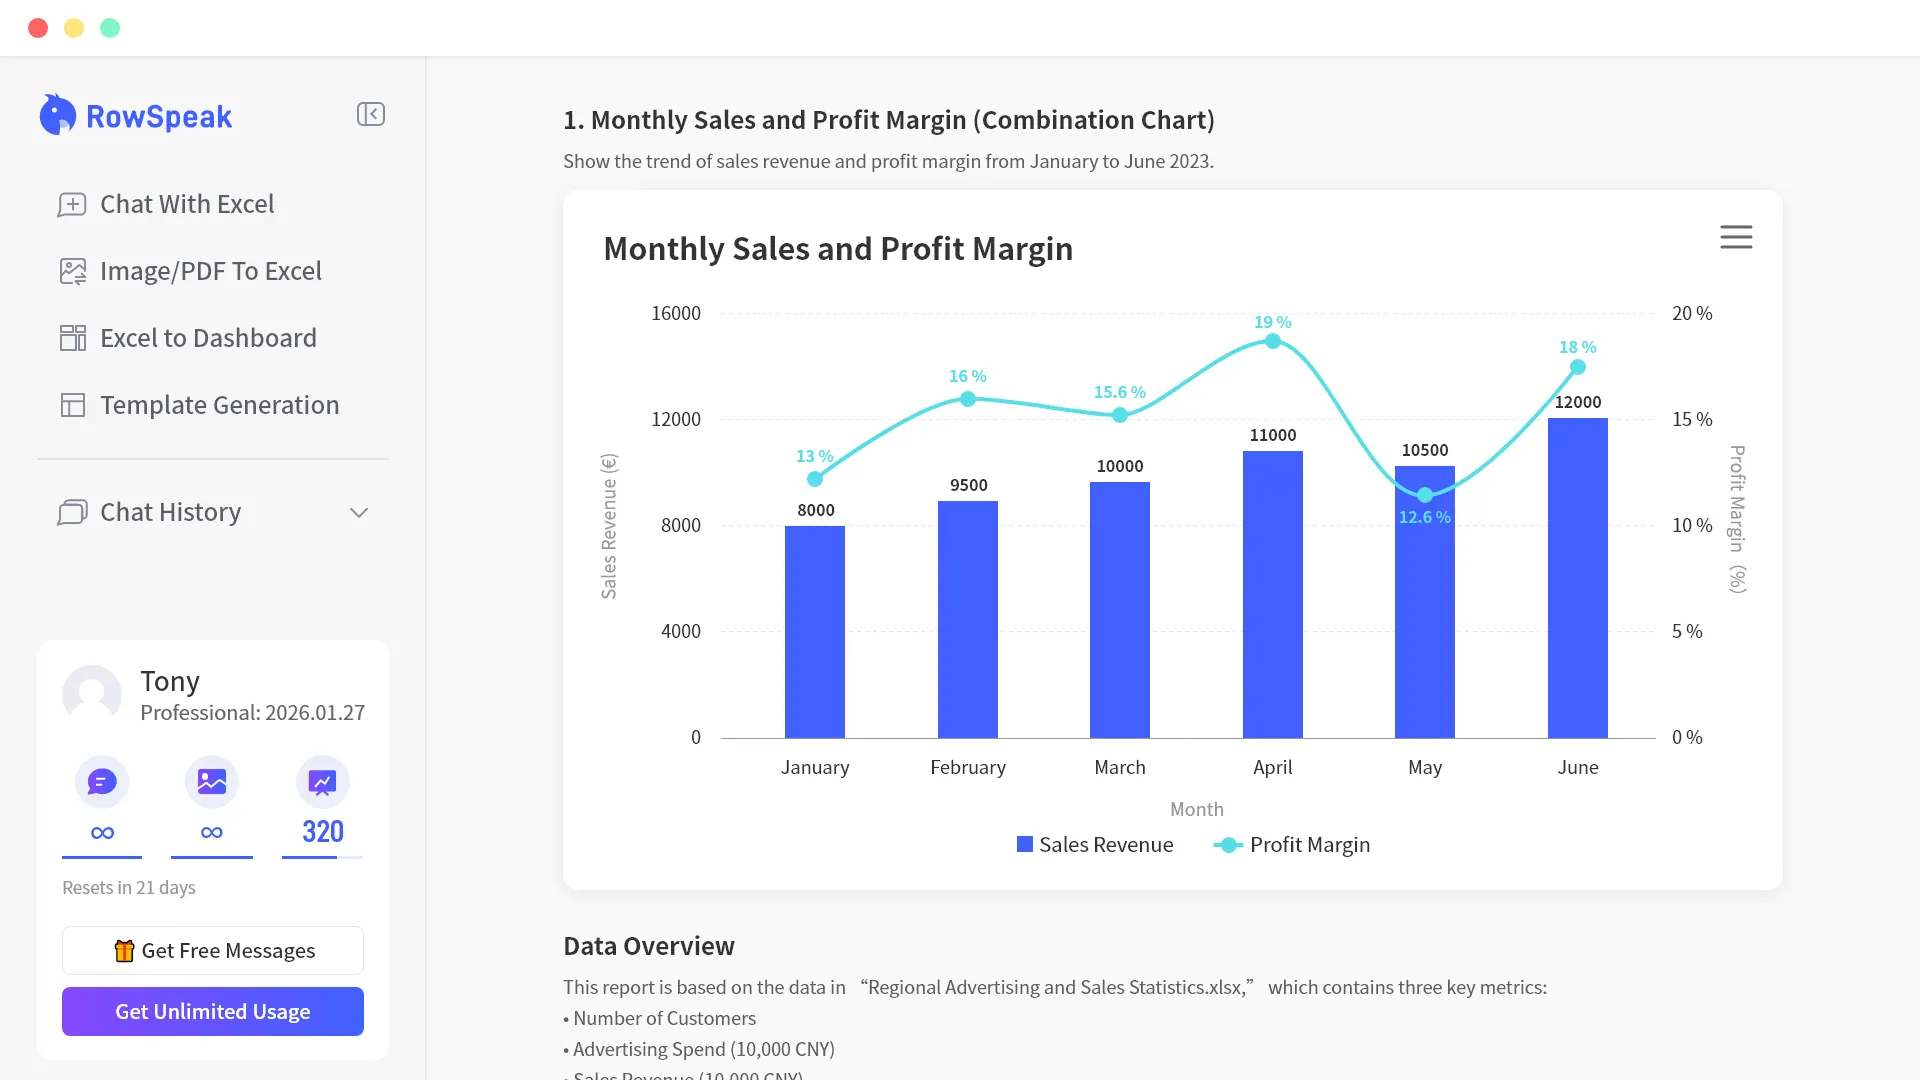
Sales Export Q4 Analysis
West $58.4K +18%
East $46.8K +11%
North $39.6K +7%
South $28.9K -3%
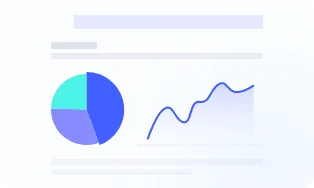
Revenue by Region
Charts & Data Visualizations$60K $48K $36K $24K $12K $0
WestEastNorthSouth
AI Explanation Panel
West grew 18% after campaign spend increased.
Auto-generated visualizations that highlight trends, ready to drop into your next meeting.
Review assumptions Change chart type Export summary